Pages

Showing posts with label Science. Show all posts

Tuesday, August 17, 2021

Science: DNA Extraction

 Today in Science we did an experiment on DNA Extraction, where we extracted DNA from a Kiwifruit. 

Aim: To extract DNA from a Kiwifruit.

Equipment: Water, test tube, beakers, spatula ethanol, kiwifruit, ziplock bag, cloth. 

Method: 

1. Cut the kiwifruit in half and scoop out the kiwifruit in a ziplock bag.

2. Crush the kiwifruit inside the ziplock bag until chunks are gone. 

3. Add 2 pinch of salt and a little bit of water to the mixture and mix it together.

4. Then pour through cloth, collect the juice in a beaker, then transfer it into a test tube.

5. After pouring the mixture into the test tube, add Ethanol. Watch the DNA separate and collect the DNA using a spatula.

Results:
As a result, there were two layers in the test tube. At the top is the foggy looking texture which is the DNA and the bottom is just the neutral mixture that was from the start of the process. The dishwashing liquid broke the DNA cells of the kiwifruit, then the ethanol separated the DNA.    


Conclusion:
Altogether the experiment was pretty interesting to do and I enjoyed the process. Next time if I got to do this experiment again, I would like to try it on a strawberry. 

Wednesday, July 7, 2021

Science: Forces & Motion - Speeding Past School

Speeding Past School Experiment 


Aim: To see how many cars are speeding past the school.

Method:

1) Measure the distance of power pole to power pole = 50m

2) Time how long it takes a car to travel this distance.

3) Collect 10 times.

4) Calculate speed in m/s then covert it to km/hr.

5) Are there any speeders?

Roles:

- "Flag" The person indicates when the car passes their pole. 

-  "Timer" The person starts when the car stops and when the car passes their pole.  

- "Writer" The person writes down the time speeds.

Results:

SpeedCar 1Car 2Car 3car 4Car 5car 6car 7car 8Car 9Car 10Average
Time4.843.805.575.833.805.173.134.903.354.184.457
m/s-110.3313.158.978.5713.159.6715.9710.2014.9211.9611.21
km hr-137.18847.3432.29230.85247.3534.81257.49236.7253.71243.05640.38

Conclusion:
In conclusion in this experiment, the results are all different. Some cars are in the line of 30 to 50 and some others are past the limit of 50 km/hr but only by a few seconds. The average speed according to our experiment was 40.36 km/hr.     

Wednesday, May 26, 2021

Corrosion of Metals - Science

Aim: To investigate the factors that cause rusting in iron. 

Equipment: Eight test tubes, test tube rack, a bung, four iron nails, hot water, vaseline gel, nail polish or paint, zinc pellets or magnesium ribbon. 

Method:

1. Label eight test A - H and place them in a test tube rack. 

2. Fill all test tubes with equal volumes of water - enough to cover the nails. 

3. Test tube contents:

A = Nail

B = Tap water + nail.

C = Salty water + nail.

D = Boiled water, oil + nail.

E = CaCI, bung + nail

F = Water, vaseline + nail

G = Water + painted nail

H = Zinc, water + nail

3.) Leave the test tubes for at least 3 days. 

Hypothesis:  A-C will rust especially C. While D-G is not gonna rust.

Picture of BEFORE:


Picture of After:


Monday, April 12, 2021

Making Salt 2 - Science

Aim: To produce copper sulfate salt by reacting copper oxide with an acid. 

Equipment: Copper oxide powder, dilute sulfate acid, 50 mL measuring cylinder, two 100 mL beakers, Bunsen burner, tripod, gauze mat, funnel, filter paper, thermometer, spatula, evaporating basin, stirring rod.  

Method:

1. Add 20 mL of sulfuric acid to a 100 mL beaker. Heat the acid until it reaches 70°C. Turn off your Bunsen burner. 

2. Once heated, use a spatula to add pea-sized portions of copper oxide to the beaker. Stir the mixture for 30 seconds.

3. Repeat step 2 until no more will dissolve. Allow the beaker to cool.

4. Fold the filter paper and place it in the funnel. Place the filter funnel into the second beaker. 

5. Make sure the beaker is cool enough to hold at the top. The contents should still be hot. You may need your teacher to complete this step. 

6. Gently swirl the contents of the beaker to mix, and then pour into the filter paper in the funnel. Allow to filter through. 

7. Rinse the beaker you used to heat the mixture previously, and place it back on top of your tripod filled with 50-60 mL of water. 

8. Place the evaporating basin on top of the beaker and carefully pour some of the solution from the beaker into the evaporating basin.   

9. Gently heat the beaker until the solution in the evaporating basin has reduced by half.

10. Leave the evaporating basin to cool. Once cool, move the evaporating basin to a warm place where it will not be disturbed and observe over the next few days. Blue copper sulfate crystals should form. 

Observations: Bubbles and blue acid appeared as we added the copper acid into the sulfate acid, using a funnel and filter paper. 

Photos:


Monday, March 29, 2021

Making Salt - Science

Aim: To produce sodium chloride salt by carrying out a neutralization reaction.

Equipment: 50 mL and 200 mL beakers, dilute HCI (Hydrochloride acid), dilute NaOH (Sodium hydroxide), 25 mL measuring cylinder, a glass stirring rod, spotting tile, Universal indicator solution, tripod, gauze mat, Bunsen burner, evaporating basin.

Method:

1. Using the measuring cylinder measure 10 mL of HCI and pour it into your 50 mL beaker. Add dilute NaOH a few drops at a time while stirring with the glass rod.

2. Every 10-15 drops stop adding the NaOH and use the glass stirring rod to transfer a drop of the solution to a spotting tile. Test its pH using Universal indicator.

3. Keep adding NaOH and testing the solution by repeating step 2. As you get closer to neutral you may need to test the solution after every drop. 

4. Pour the neutral solution into an evaporating basin and evaporate the water out of the solution using the equipment set up shown above.

Observations: We made a variety of colours such as purple, light pink, and red. The aim of this was to make green which we couldn't make.

No photos provides

Tuesday, February 16, 2021

Physical/Chemical Change

 Title: Physical or Chemical Change ( Heating ZnO )

Hypothesis: I have no clue

Equipment: Sample of ZnO (Zinc oxide)

- Heat Source - Hot plates

- Scales

- Heat proof container - Evaporating dish

- Tongs

- Heat proof mat

Method:

1. Get sample of ZnO in an evaporating.

2. Weigh the ZnO and Container - Record weight.

3. Heat container and ZnO on hot plate.

4. Observe any changes - Use phone for before and after photos. (video)

5. Take off heat and put on heat proof mat.

6. Let cool - observe - photos.

7. Re weigh.

Results: The powder had changed into a light green colour when the heat started getting hotter. I think this is a chemical change because the colour changed and it cannot be reversed. The weigh of our powder before was 36g, then changed to 35g during the heating process.  

Conclusion: At the end the experiment was good and I didn't have an hypothesis. 


Tuesday, November 3, 2020

Dissecting Pigs Heart

Today in Science, we started dissecting an pigs heart. We looked at the different parts and where they were in the heart. The different parts we looked at was the Atrium, Ventricle, Valves, Left + Right side of heart, Arteries and Veins. The parts we discovered were the Aorta, Heart Strings, Left + Right side of heart, Ventricle and Valves. 

Equipment that was used: Scalpel, Scissors and Tweezers. 

-What have we been learning about? We have been learning about the different parts of the heart and how they function in the body.

- Why are we dissecting a heart? We are dissecting a heart to discover where the parts are in the heart, which part is which and, study how they work and affect our body. 

- What are the parts of the heart? Did you see them? 

  • Left + Right side of heart
  • Ventricle
  • Valves
  • Arteries

We saw the left + right side of the heart, Aorta, Heart strings, Valves, and Ventricles. 

- Did you enjoy the dissection? Why/why not?

I did enjoy dissecting a pigs heart because it was cool to see where the different parts were, what they looked like and, have a cool, fun experience doing it in real life instead of watching a video of someone doing it. 


Tuesday, September 15, 2020

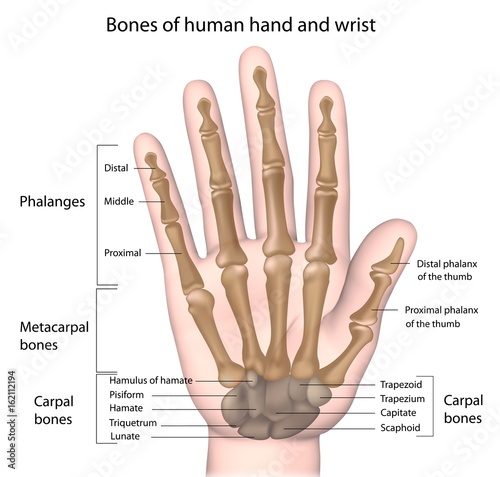
Hands - Science

How does your hand work and what are the parts?

Bones:
There are 27 bones in your hand:
1. 8 bones in your wrist
2. 5 bones in your palms
3. 14 bones for your fingers and thumb

Tendons:
What is a tendon?
A tendon is a stringy connective tissue which attaches muscle of the forearm bone to the phalanges which let your fingers move up and down. Tendons also attach muscles to structures such as the eyeball.  

Muscles:

The muscles in your hand are thumb muscles, palmar muscles and little finger muscles. The main muscles that you use to move your fingers are the ones in your forearm, which is called the flexor digitorum profundus. This muscle is mainly used to control the tendons. It does this by contracting and relaxing. 

Ligaments: 
Ligaments are strong bands of tissue, that connect bone to bone. It makes sure that your hands are moving the right way. The ligaments protects these structures and prevents them from bending, twisting or tearing. They basically help to maintain stability in the body. 


Bones of the hand, labeled. - Buy this stock illustration and explore  similar illustrations at Adobe Stock | Adobe Stock

Friday, August 14, 2020

Lemon Power

Lemon Power

Voltage: Voltage is the energy that electrons get from a power supply.

Current: Current is the movement of electrons.

Aim: To create voltages out of lemons.

Method:

  • Roll the lemon out so the inside is liquidy. 
  • Stick pieces of zinc and copper into the lemon.
  • Connect the lemon up to a voltmeter.
Results:

1. 2


3. 2.3


Discussion:
When we rolled the lemons we made the inside liquidy. Because we rolled the lemon we freed the acidicly charged particles. The acidicly charged particles moved around, creating a current. More lemons, more acidicly charged particles, means more voltage.

Conclusion:
This experiment worked successfully and we got different results by trying different strategies. Overall I enjoyed today's lesson and I'm looking forward to the following lessons.

Tuesday, March 17, 2020

Separating a Mixture using Evaporation

Aim: Trying to Separate the Solute from the Solvent / making crystals
Hypothesis: I have no idea what I thought was going to happen 

Equipment: Copper sulfate solution, 250mL Beaker, heat proof mat, Evaporating Basin, Element.

Method:
1. Set up element
2. Add 100mL of hot water to the beaker and place on the element.
3. Add copper sulfate to the evaporating basin until it is quarter full.
4. Carefully, place the evaporating basin on top of the beaker.
5. Turn on the element to 8
6. Heat the solution until most of the solvent has been evaporated and crystals of solute are forming.
7. Turn off the element - careful not to touch as it will be hot for a long time.

Observation: I saw the liquids steaming up and the copper sulfate solution starting to loosen up. After a few minutes, the copper sulfate solution started getting hard and also started to look a bit like a crystal but in one whole. 

Conclusion: I didn't have a Hypothesis but i'm pretty sure it was false.

Evaluation: Yes I enjoyed doing this experiment even though I came in class a bit late. I enjoyed it because it was interesting to see the copper sulfate solution dissolved at the end and kinda turning out to look like a crystal. Overall it was good and would want to do it again.

Monday, March 16, 2020

Chromatography - Science

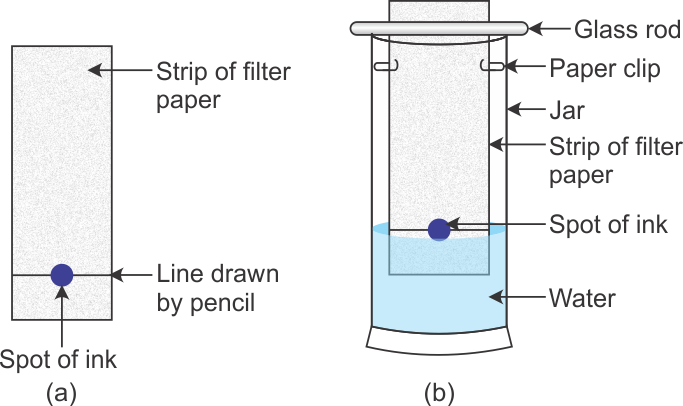
Aim: To Separate the different pigments from ink using Chromatography

Hypothesis: What I think would happen once my colours are blending together, the outcome will straight away form into a darker colour.

Equipment: Felt Tip Pen, Filter Paper Strips, Test Tube, Measuring Cylinder, Pencil.

Method:

1. Draw a line across the filter paper in pencil, 5cm from the bottom.
2. Draw a coloured dot in the centre of the line.
3. Measure out 10mL of water and place in the test tube.
4. Place in the filter paper in the test tube and fold over the side. Make sure the pencil line is not in the water.
5. Wait for 5 minutes and observe the results.


Observation: The results of the two colours blending together, it came to be successful. The black didn't stay as its colour it changed into multiple colours such as pink, light blue, orange, yellow, etc. My other colour which was dark blue actually went into a light blue instead of getting dark.

Conclusion: No my hypothesis wasn't right.

Monday, February 17, 2020

Solubility Dissolving Experiment

Aim:
To see if salt or baking soda dissolves more

Hypothesis:
I think that the baking soda will dissolve more because powder is thinner and can disappear quickly when it is dissolving in a liquid, in my opinion.

Equipment: A 250 mL beaker, 100 mL measuring cylinder, salt, baking soda, a stirring rod, a teaspoon and a ruler.

Method:
1. Fill the beaker with 100 mL of tap water.
2. Add a level teaspoon of baking soda. A level teaspoon is obtained by running your ruler across the edges of the teaspoon).
3. Stir the solution until all of the baking soda has dissolved.
4. Repeat steps 2 and 3 until no more baking soda and then it will dissolve into the solution.
5. Record how many teaspoons of baking soda were added.
6. Repeat the experiment, with the table salt.

Results:

SoluteNumber of teaspoons that dissolved in 100 mL of water
Baking soda
2 teaspoons
Table salt5 teaspoons


Discussion:
This experiment involved dissolving a solute. The first substance we dissolved was table salt, the results we got came upto 5 teaspoons and i'm pretty happy of how many teaspoons we did. Our results means that the mixture of salt and water can dissolve really well together.

For our second experiment, this time we did a mixture of baking soda and water, the results we got came upto 2 teaspoons. Our result means that the mixture of baking soda and water can not combine very well together. 

Conclusion:
My hypothesis that I thought would combine together well was baking soda, but I found out at the end of my results was wrong. The table salt dissolved more in the water than the baking soda and had more teaspoons displayed. I thought that the baking soda would dissolve more because its particle size was much more smaller than the table salt. 

Tuesday, November 5, 2019

Hurumanu - Climate Change and The Furture

Aim: To look at the different ways we can prevent climate change in the future.


What places will be effected? 
Different places in New Zealand and the Pacific Island.


What else do we need to think about? 
Salt Water and People who live near Rivers.


What other places around NZ will be affected?
Timaru, Gisborne,     


What does this do to our drinking water?
We will have salt water from underground instead. 


What are the main concerns?
Salt water will be getting into other peoples water from underground.


What can we do?
  1.  Electric Cars.
  2.  Public Transports. 
  3.  Try not use more energy.   


What is the one, silver bullet solution?
There is no one silver bullet.


What is the mix of things we need to start doing?
  1.   Using Renewable's more 
  2.   Transport
  3.   Using Solar heating's
What are 3 others you can think of?
  1.   Recycling more
  2.   Reusing more
  3.   More running or walking instead of using electricity 
Activities:

Carbon Footprint

Carbon Footprint explained

Dwelling
Water
Recreation
Heating and cooling
Electricity
Transportation
Food
Waste
Air Travel
Consumption

Colour 1: for actions they are already doing 
Colour 2: for actions that they pledge to undertake in the future

Ecological Handprint The Ecological handprint builds on the concepts from the Carbon Footprint. We will look at the positive actions of:

  1. Transportation
  2. Community
  3. Consumption
  4. Water
  5. Food
  6. Home
  7. Waste


1 Colour: For each action you are already doing 
2 Colour: For each action you would like to do in the future

Tuesday, October 29, 2019

Hurumanu - Water Cycle

Water Cycle Experiment
Aim: To learn about water on Earth

Material:

  1.  1x Zip lock bag
  2.  1x Vivid pen
  3. 2x strips of Double sided tape
  4. ½ a cup of water
  5. 2x drops of blue food colouring
  6. 1x Scissors
  7. 1x teaspoon of baking powder
  8. 1x Litmus paper 
  9. 1x Soda water

Steps:


Experiment 1:
Step 1:
Grab your Zip lock bag.

Step 2:
Grab a vivid pen.

Step 3:
Draw the water cycle on the zip lock bag with the vivid.

Step 4:
Get the 2x of the strip double tape. 

Step 5:
Stick the tape on the top below the zip and at the bottom of the bag.

Step 6:
Carefully add ½ a cup of warm water
and 2x drops of blue food colouring into the bag.

Step 7:
Close the zip lock bag and give it to the teacher to stick on the glass
window where there is sun shining on. 

Experiment 2:


Step 1:
Grab your zip lock bag

Step 2:
Grab a vivid pen

Step 3:
Draw the water cycle on the zip lock bag with the vivid.

Step 4:
Get the 2x of the strip double tape. 

Step 5:
Stick the tape on the top below the zip and at the bottom of the bag.

Step 6:
Carefully add ½ a cup of warm water and soda water into the bag.

Step 7: Add 2x drops of blue food colouring into the bag.

Step 8:
Add 1 teaspoon of baking powder into the bag

Step 9:
Close the zip lock bag with the litmus paper at the tip of the zip
and give it to the teacher to stick on the glass window where there is sun shining on.


Two Images:


Findings:


The Water Cycle: Bag 1
CO2 Water Cycle: Bag 2
Acid
Desert Water Cycle
Bag 3
Does it cycle?
21
Amount of Water
21
Acidity
11
For bag 1 it did a small amount of the water cycle and it also had a small amount of water.
For bag 2 the water cycle was no change at all and the water didn't change. 


Key: Water and acidity amount: 1 = none 
2 = small 
3 = large 

Conclusion:

The normal water cycle did have a little movement through the cycle and the water stayed the same.

The water cycle with acid didn't do anything to the litmus paper and the water stayed the same as well.

Hurumanu - Fossil Fuels

Aim: To learn about the impact of fossil fuels on our environment.

What Fossil Fuels are mined?

  1.   Coal
  2.   Oil
  3.   Gas


How are they mined?

1. 
2. 
3. 
4. 

Where are they mined?

1.  
2.  
3. 


Material:
  1.  Cookie
  2.   Toothpick
  3.   Plate
Steps:
  1. Draw a picture of the Cookie.  
  2. Draw a picture of a Habitat.  
  3. Start mining the Chocolate Chips off the cookie without breaking it.  
  4. Count how many Chocolate Chips you have mined and then show the teacher.  
  5. Eat the cookie if you want too.
  6. Then answer the questions about your Habitat.  

Picture of cookie and habitat:


Conclusion: 
Today in science, we have been focusing on fossil fuels. We did some mining on a cookie, drew some pictures of the cookie and a habitat and then answered some questions related to the habitat that we have chose. During the lesson, I have learned that mining actually effects our environment and our surroundings. 

Friday, October 25, 2019

Hurumanu - Renewable Energy

Aim: To make a solar powered oven.

Materials: 

  1.   Cellotape
  2.   Pizza box
  3.   Glab wrap
  4.   Tin Foil
  5.   Scissors
  6.   Newspaper
  7.   Ruler
  8. Straw
  9. Vivid Marker
  10. Black Plastic
  11. Marshmallow
  12. Biscuit
Steps:
  1. Cut out the flap on the lid of the Pizza Box so that it is 5cm around the edge.
  2. Cellotape some Tinfoil on the inside of the flap.
  3. Cellotape some glad-wrap so that the hole you have cut on the Pizza Box lid is covered over with the Glad-Wrap.
  4. Put a piece of Black Plastic on the bottom of the inside of the Pizza Box.
  5. Make a Paper square that fits inside the Pizza Box and lays around the edge.
  6. Put a Marshmallow on top of a Chocolate Biscuit, place it on a Plastic Plate and put it in the Solar Oven.
  7. Put it in the sun to cook.
Findings:

Time
Temperature
0
Haven't started
15
Haven't started
30
Haven't started
45
Haven't started

Conclusion:

This term in week 2 in science, we have started a new experiment called Renewable energy. We got into groups of four and I am with Janel, Keyana and Tahnesha. We had to make a solar powered oven by using the following materials on Mr Palmer's blog and also watch a video and write down the steps on how to make it. After that we got to make a s'more and put it in our solar oven that we made and leave it resting in the sun to cook.
Overall it was a great experiment and lesson and I enjoyed learning about renewable energy.


Aim: To make a presentation that investigates different renewable energy's.

Section 1: Title Page

Make a title page that incorporates all renewable energy 's Hydro, Solar, Wind and Wave. 

I have done my title page on paper.

Section 2: Definitions

Define and provide a picture of each energy type.

Hydro Energy:
Image result for hydro energy"


Solar Energy:
Image result for solar energy"

Wind Energy: 
Image result for wind energy"

Wave Energy:
Image result for wave energy"

Section 3; Investigate each of the 4 Energy types.
( Hydro ,Solar ,Wind ,Wave ) 

  1. Type: 
Hydro energy is a type of energy that comes from flowing water into electricity. 

Solar energy is a type of energy that is emitted from the sun, for example, it is sunlight that shines through a window and heats up a room.

Wind energy is a electrical energy obtained from harnessing the wind with windmills or wind turbines.  

Wave energy is the capture of energy of wind waves to do useful work for example, electricity generation or pumping water. 
  1. Is it used in NZ ?
Hydro energy has been a part of New Zealand's energy system for over 100 years and continues to provide more than half of the country's electricity needs. 

Solar energy in New Zealand is on the rise, but operates in an entirely free market with no form of subsidies or intervention from the New Zealand Government

Wind power- In New Zealand there are 17 wind farms operating. As of December 2017, New Zealand had an installed wind generation capacity of 690 MW. IN the 2017 Calendar year, wind power produced 2,120 GWh of electricity.    

 New Zealand has large ocean energy resources but does not yet generate any power from them. TVNZ reported in 2007 that over 20 wave and tidal power projects are currently under development.  


Other Countries that use it?

Hydro energy - There are also other countries that have hydro power such as China, Canada, Brazil, the United States and Russia, they also have big land masses.

 Solar energy - China, United states, Japan, Germany, India, Italy, United Kingdom and Australia have Solar Energy. 

Wind energy - France, Canada United Kingdom, Spain, India, Germany, United States and China have Wind energy.

Wave energy - The Western coasts of Scotland, Northern Canada, Southern Africa, Australia, Northwest Coast of United States and particularly Alaska have Wind energy.   

How is it used to generate electricity?

Hydro Power plants capture the energy of falling water to generate electricity.

Solar energy generates electricity indirectly by capturing the heat of the sun to produce steam, which runs a turbine that produces electricity.  

Wind power converts the kinetic energy in wind to generate electricity or mechanical power. 

Wave energy is produced when electricity generators are placed on the surface of the ocean.   


Draw and label a diagram of the main parts of the electricity generator?
This can be done on paper and uploaded or on a drawing program on your device. I do not want any internet images or pictures. They must be hand drawn using a ruler and labelled. 


Section 4: Renewable Energy in the future.

List 10 ways that renewable energy will be used in the future to replace our current activities.